|
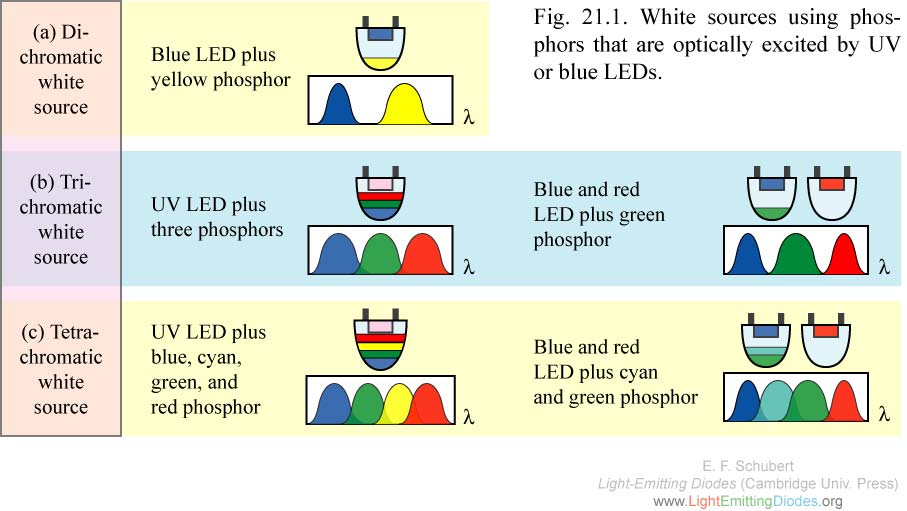
Fig. 21.1. White sources using phosphors that are optically excited by UV or blue LEDs.
|
|
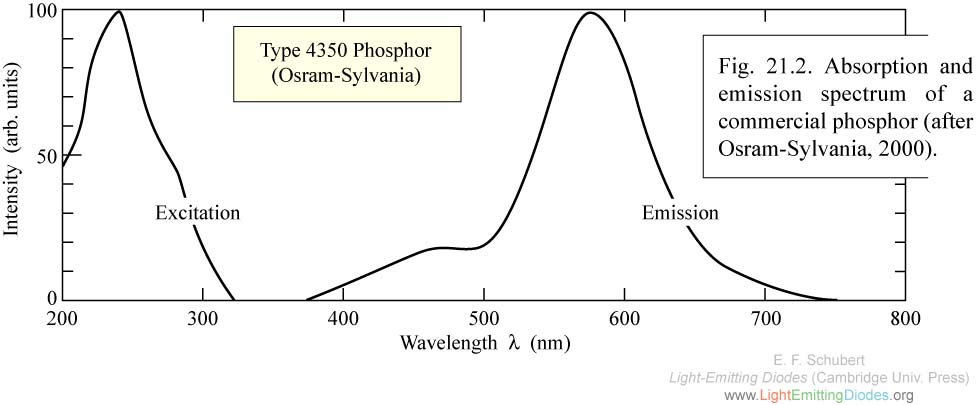
Fig. 21.2. Absorption and emission spectrum of a commercial phosphor (after Osram-Sylvania, 2000).
|
|
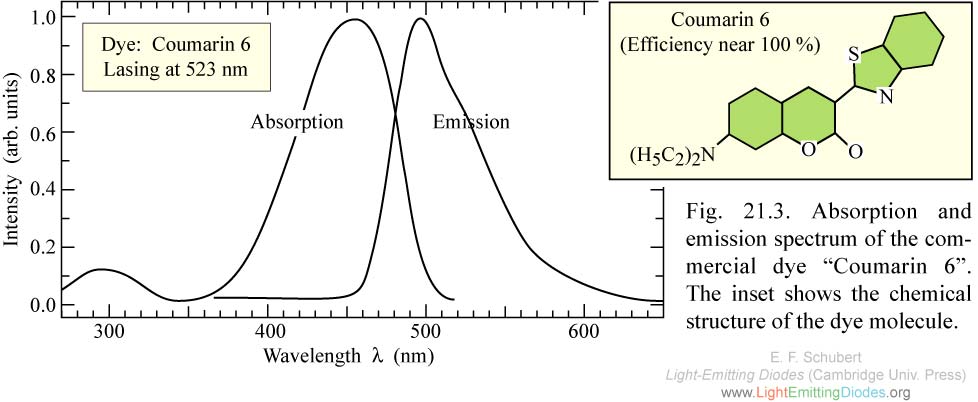
Fig. 21.3. Absorption and emission spectrum of the commercial dye “Coumarin 6”. The inset shows the chemical structure of the dye molecule.
|
|
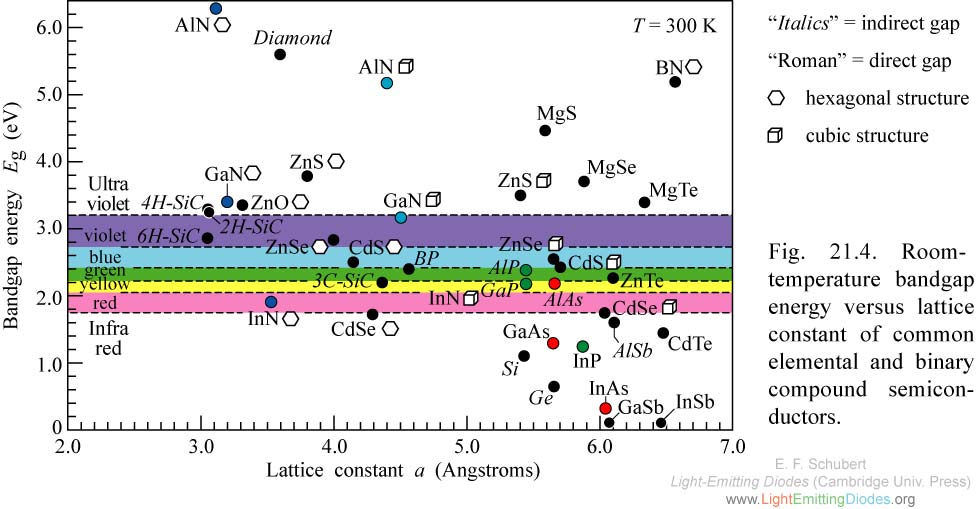
Fig. 21.4. Room-temperature bandgap energy versus lattice constant of common elemental and binary compound semiconductors.
|
|
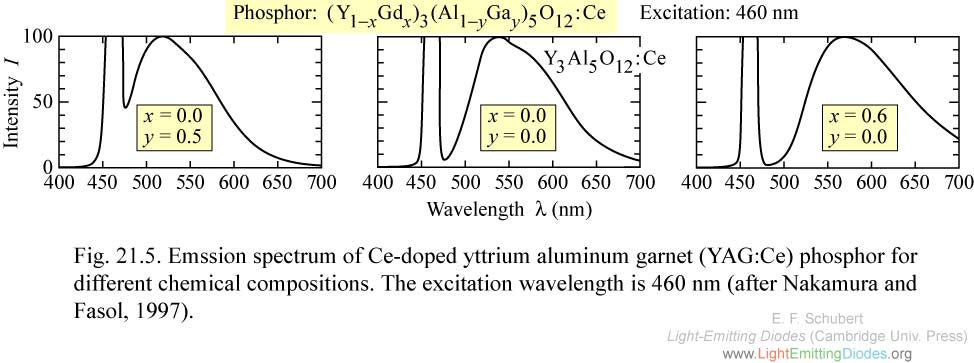
Fig. 21.5. Emssion spectrum of Ce-doped yttrium aluminum garnet (YAG:Ce) phosphor for different chemical compositions. The excitation wavelength is 460 nm (after Nakamura and Fasol, 1997).
|
|
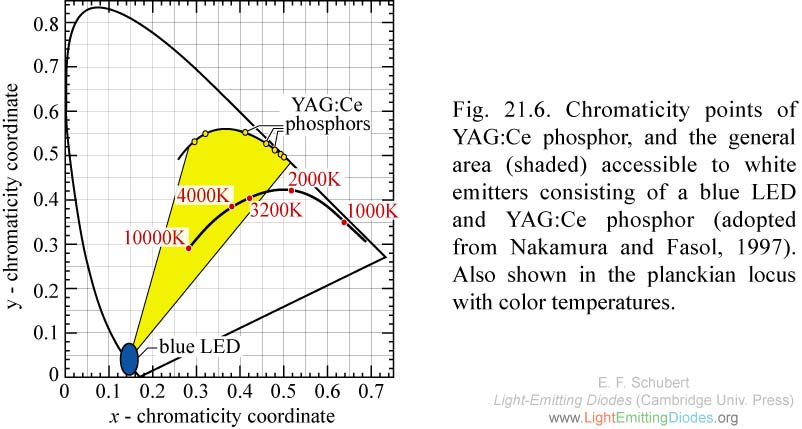
Fig. 21.6. Chromaticity points of YAG:Ce phosphor, and the general area (shaded) accessible to white emitters consisting of a blue LED and YAG:Ce phosphor (adopted from Nakamura and Fasol, 1997). Also shown in the planckian locus with color temperatures.
|
|
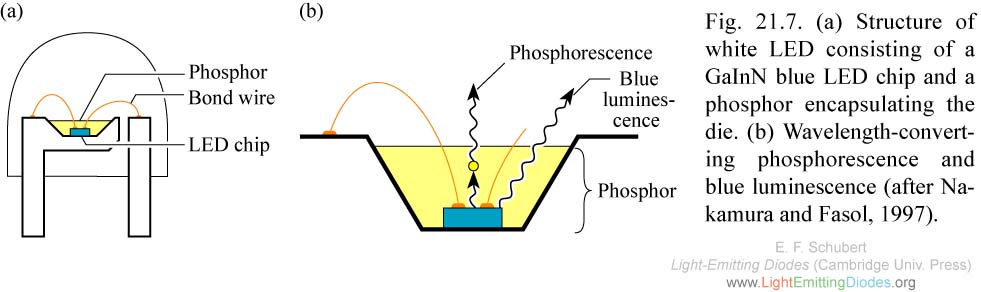
Fig. 21.7. (a) Structure of white LED consisting of a GaInN blue LED chip and a phosphor encapsulating the die. (b) Wavelength-converting phosphorescence and blue luminescence (after Nakamura and Fasol, 1997).
|
|
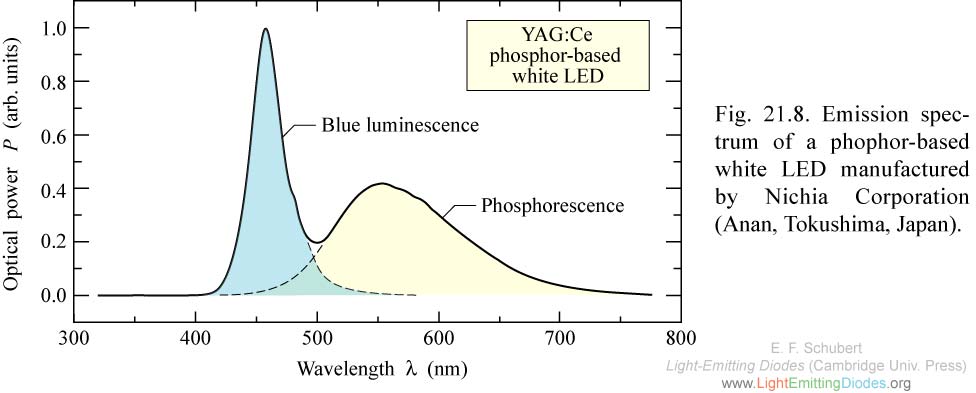
Fig. 21.8. Emission spectrum of a phophor-based white LED manufactured by Nichia Corporation (Anan, Tokushima, Japan).
|
|
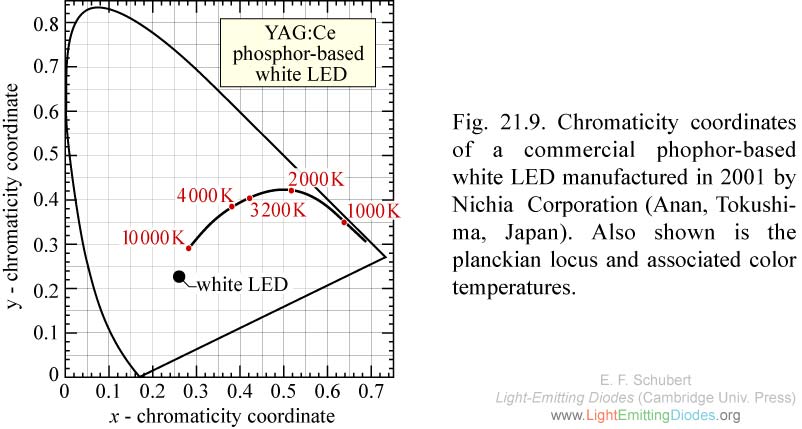
Fig. 21.9. Chromaticity coordinates of a commercial phophor-based white LED manufactured in 2001 by Nichia Corporation (Anan, Tokushima, Japan). Also shown is the planckian locus and associated color temperatures.
|
|
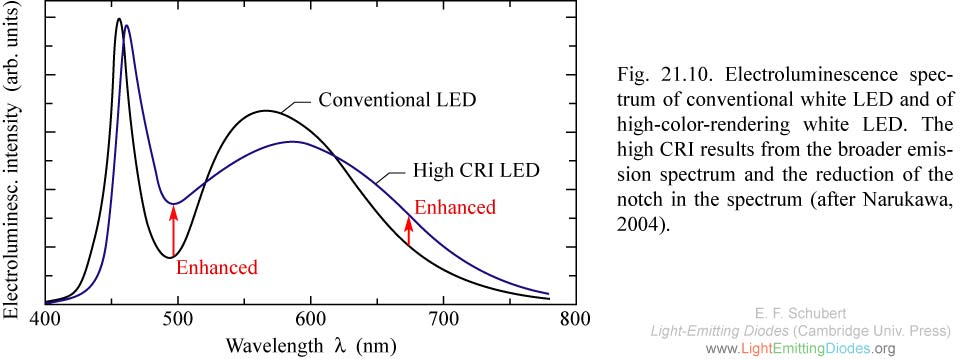
Fig. 21.10. Electroluminescence spectrum of conventional white LED and of high-color-rendering white LED. The high CRI results from the broader emission spectrum and the reduction of the notch in the spectrum (after Narukawa, 2004).
|
|
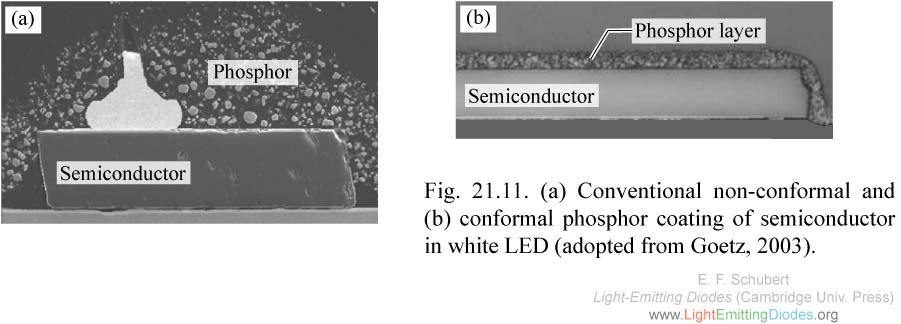
Fig. 21.11. (a) Conventional non-conformal and (b) conformal phosphor coating of semiconductor in white LED (adopted from Goetz, 2003).
|
|
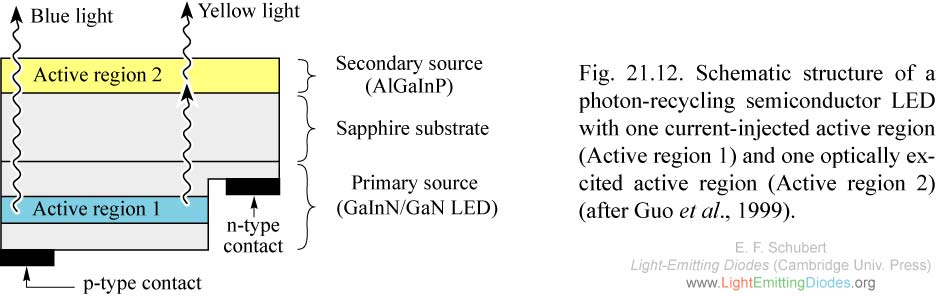
Fig. 21.12. Schematic structure of a photon-recycling semiconductor LED with one current-injected active region (Active region 1) and one optically excited active region (Active region 2) (after Guo et al., 1999).
|
|
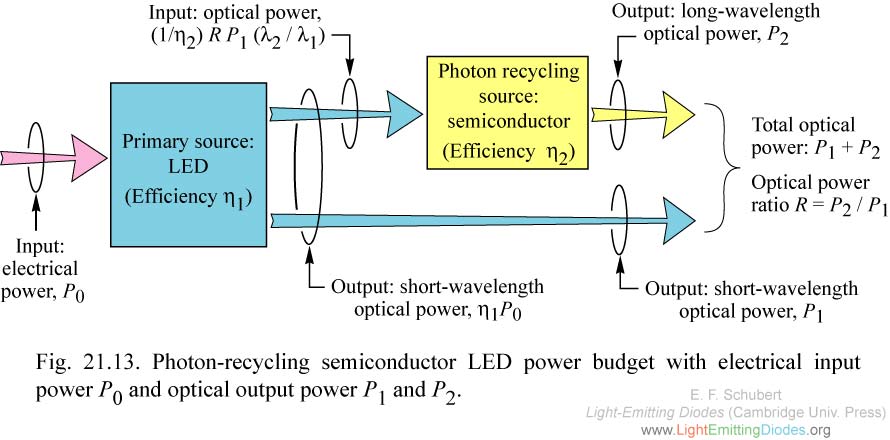
Fig. 21.13. Photon-recycling semiconductor LED power budget with electrical input power P0 and optical output power P1 and P2.
|
|
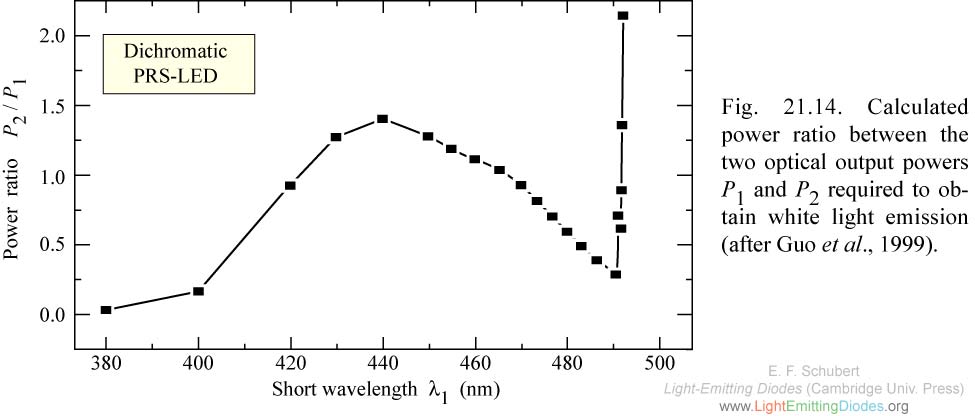
Fig. 21.14. Calculated power ratio between the two optical output powers P1 and P2 required to obtain white light emission (after Guo et al., 1999).
|
|
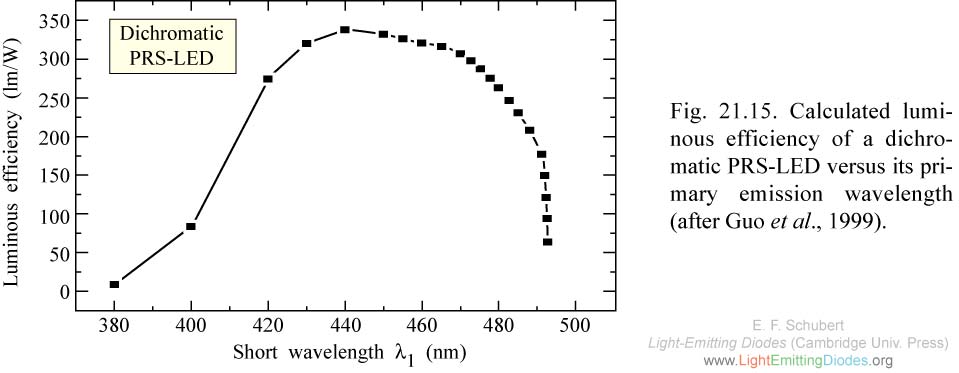
Fig. 21.15. Calculated luminous efficiency of a dichromatic PRS-LED versus its primary emission wavelength (after Guo et al., 1999).
|
|
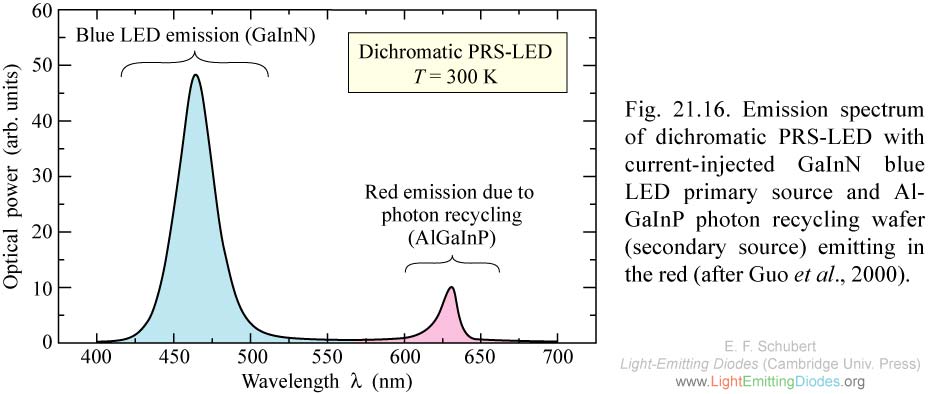
Fig. 21.16. Emission spectrum of dichromatic PRS-LED with current-injected GaInN blue LED primary source and AlGaInP photon recycling wafer (secondary source) emitting in the red (after Guo et al., 2000).
|